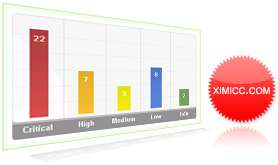
竖型的图表虽然看起来比横向的要复杂,但是实现原理还是一样利用了背景属性的设置。
1.首先在XHTML中我们加入一个有五个项目的列表,最终的效果中这五个项目将会显示成不同背景的条柱,当然它们的高度是不一样的,示例中的设置每个点数对应10像素的高度。其中的对应关系除了点数和高度外,在CSS样式名中也要体现出来,后者主要是控制条柱的背景。
- 16
- 7
- 3
- 8
- 2
2.CSS部分我们先来看一下最外围的#vertgraph:
#vertgraph {

width: 378px;

height: 207px;

position: relative;

background: url("https://ximicc.com/attachments/520.gif") no-repeat;

}
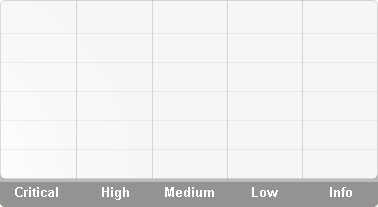
这里的宽度和高度是整张图标的尺寸,也是ul元素的尺寸的参考标准。而这里的尺寸之所以这么设定,事实上还是由背景图片的宽高来决定的:

3.列表项目的CSS设置:
#vertgraph ul li {

position: absolute;

width: 28px;

height: 160px;

bottom: 34px;

padding: 0 !important;

margin: 0 !important;

background: url("https://ximicc.com/attachments/u20.jpg") no-repeat !important;

text-align: center;

font-weight: bold;

color: white;

line-height: 2.5em;

}
列表项采用了绝对定位,因为后面我们要通过left来控制各个项目之间的距离。列表项底部通过bottom属性空出34像素的距离来显示说明文字,其它的CSS属性除了字体的设置之外,最主要的就是background属性了。大家可以注意到,虽然每个条柱都是不同的背景,但是整个CSS中只用到一张列表项背景图,事实上这也并不是什么玄妙的事情,控制好CSS中的background-position属性很容易就能实现效果,大家观察一下这张背景图片:

4.对背景的定位关键就在于以下这段CSS代码:
#vertgraph li.high { left: 24px; background-position: 0px bottom !important; }

#vertgraph li.low { left: 101px; background-position: -28px bottom !important; }

#vertgraph li.lower { left: 176px; background-position: -56px bottom !important; }

#vertgraph li.medium { left: 251px; background-position: -84px bottom !important; }

#vertgraph li.info { left: 327px; background-position: -112px bottom !important; }
整张背景的宽度是140像素,五条色带均匀分布,当然就是在宽度上各占28像素。有了这些数据之后,我们就可以很精确的对background-position进行控制了。如果你对背景定位属性不是很了解,可以在入门教程中深入学习,示例中定义的两个值第一个值影响水平位置,第二个值影响垂直位置,它们的单位可以是像素、百分比或是TRBL,如果当中只指定了一个值,那么另一个值默认就是50% 。
